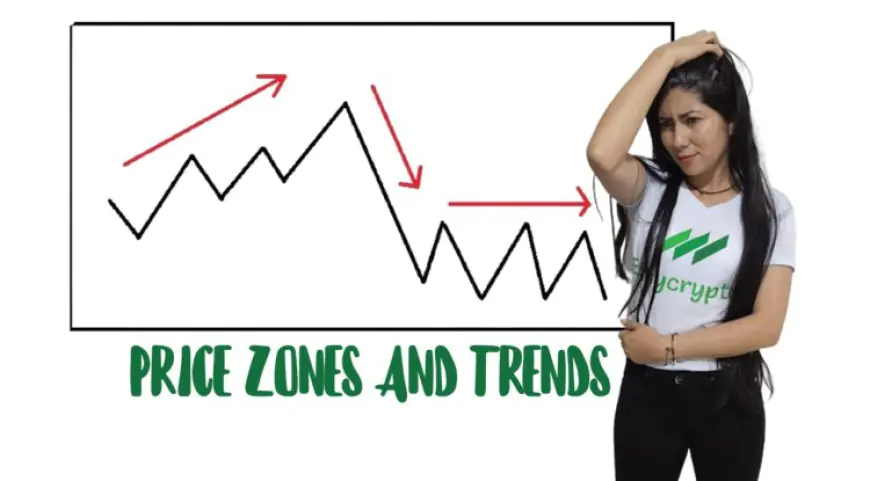
Unlocking Trading Success: The Importance of Price Zones and Trend Analysis
Discover how understanding price zones and trends in trading can unlock success in your trading strategy. Learn how to analyze and utilize these key indicators to maximize your profits in the market.
The world of trading can be overwhelming, with many factors to consider before making a decision. One of the most important aspects of successful trading is understanding the relationship between price zones and trends. Price zones are key areas in the market where the price of an asset tends to react in a certain way, while trends refer to the general direction of the market. By understanding how these two indicators relate to each other, traders can make more informed decisions and potentially maximize their profits.
In this article, we will take a closer look at price zones and trends, their relationship, and how traders can analyze and utilize these key indicators to improve their trading strategy. Whether you're a seasoned trader or just starting, this guide will provide valuable insights to help you navigate the market with confidence.
Price Zones: What Are They and How Do They Work?
Price zones are specific levels on a price chart where the price of an asset tends to react in a certain way. These zones are often considered as key areas of support or resistance, where the price may bounce off or break through.
Support zones are price levels where the demand for an asset is strong enough to prevent the price from falling further. Resistance zones, on the other hand, are price levels where the supply of an asset is strong enough to prevent the price from rising further.
Identifying price zones is a crucial part of technical analysis, as they can provide traders with key levels to enter or exit a trade. By understanding these levels, traders can anticipate potential price movements and adjust their strategy accordingly.
There are several methods for identifying price zones, including:
- Historical price levels - looking at past price action to identify key levels where the price has reacted in the past.
- Moving averages - using moving averages to identify areas of potential support or resistance.
- Fibonacci retracements - using the Fibonacci sequence to identify potential support or resistance levels.
- Pivot points - using pivot points to identify potential support or resistance levels based on the previous day's price action.
By using these methods, traders can identify key price zones and potentially improve their trading strategy. In the next section, we will explore the relationship between price zones and trends, and how they can be used together to make informed trading decisions.
Trends: Understanding the General Direction of the Market
Trends refer to the general direction of the market, whether it's up, down, or sideways. Understanding the current trend is crucial in trading, as it can provide valuable insights into potential price movements and help traders make informed decisions.
There are three types of trends in trading:
- Uptrend - characterized by a series of higher highs and higher lows.
- Downtrend - characterized by a series of lower lows and lower highs.
- Sideways trend - characterized by a horizontal movement of price, with no clear direction.
Identifying the current trend is often done by looking at the price chart and analyzing price action. Traders can also use indicators such as moving averages, trend lines, and the relative strength index (RSI) to confirm the trend.
Once the trend has been identified, traders can use it to inform their trading strategy. For example, in an uptrend, traders may look for buying opportunities at support levels, while in a downtrend, they may look for selling opportunities at resistance levels.
However, it's important to remember that trends can change quickly, and traders should always be prepared to adjust their strategy accordingly. By combining trend analysis with price zone analysis, traders can potentially identify key levels to enter or exit a trade and maximize their profits.
In the next section, we will explore how traders can use price zones and trend analysis together to make informed trading decisions.
Price Zones: Understanding Areas of Support and Resistance
Price zones are areas on a chart where the price of an asset has historically struggled to move beyond or has found support. These zones are also known as support and resistance levels and can be identified by analyzing past price movements on a chart.
Support levels are price zones where the demand for an asset is strong enough to prevent the price from falling further. Resistance levels, on the other hand, are price zones where the supply for an asset is strong enough to prevent the price from rising further.
Traders can use price zones to help inform their trading decisions. In an uptrend, support levels can be used to identify potential buying opportunities, while in a downtrend, resistance levels can be used to identify potential selling opportunities.
It's important to note that price zones are not exact numbers but rather ranges where the price is likely to encounter support or resistance. Traders can use a variety of technical analysis tools to identify these zones, including trend lines, moving averages, and Fibonacci retracements.
In the next section, we will explore how price zones and trend analysis can be used together to identify potential trading opportunities.
Trend Analysis: Identifying Market Direction
Trend analysis is the process of analyzing the direction of a market's price movement over time. Identifying the direction of a trend is essential for successful trading as it can help traders make informed decisions about when to enter and exit trades.
There are three types of trends: uptrend, downtrend, and sideways trend. An uptrend is characterized by higher highs and higher lows, while a downtrend is characterized by lower lows and lower highs. A sideways trend, also known as a range-bound market, occurs when the price is moving within a relatively narrow range.
Traders can use various technical analysis tools to identify trends, including moving averages and trend lines. Moving averages are a popular tool as they smooth out price fluctuations and help traders identify the direction of a trend. A trend line is drawn by connecting the highs or lows of a trend and can be used to identify potential areas of support or resistance.
Combining Price Zones and Trend Analysis
Combining price zones and trend analysis can be a powerful way to identify potential trading opportunities. By identifying key support and resistance levels and analyzing the direction of the trend, traders can make more informed decisions about when to enter and exit trades.
For example, if the price of an asset is in an uptrend and has recently pulled back to a key support level, traders may look for potential buying opportunities as the price is likely to bounce off the support level and continue in the direction of the trend. On the other hand, if the price of an asset is in a downtrend and has recently approached a key resistance level, traders may look for potential selling opportunities as the price is likely to encounter resistance and continue in the direction of the trend.
It's important to remember that no trading strategy is foolproof and that there are always risks involved in trading. However, by using price zones and trend analysis together, traders can gain a better understanding of market dynamics and make more informed decisions about when to enter and exit trades.
Conclusion
In summary, understanding price zones and trend analysis is crucial for successful trading. Price zones represent areas where buyers and sellers are likely to be active, and they can help traders identify potential support and resistance levels. Trend analysis, on the other hand, helps traders identify the direction of a market's price movement and can help them make informed decisions about when to enter and exit trades.
When combining price zones and trend analysis, traders can gain a deeper understanding of market dynamics and identify potential trading opportunities. By identifying key support and resistance levels and analyzing the direction of the trend, traders can make more informed decisions about when to enter and exit trades.
It's important to note that no trading strategy is perfect, and there is always a risk involved in trading. However, by using price zones and trend analysis, traders can develop a more structured approach to trading and improve their chances of success.
In conclusion, traders who take the time to understand price zones and trend analysis are better equipped to navigate the markets and make informed trading decisions. By combining these tools with a solid trading plan and risk management strategy, traders can increase their chances of success in the highly competitive world of trading.
What's Your Reaction?
 Like
0
Like
0
 Dislike
0
Dislike
0
 Love
0
Love
0
 Funny
0
Funny
0
 Wow
0
Wow
0
 Sad
0
Sad
0
 Angry
0
Angry
0
Soy un trader e inversionista apasionado con un profundo conocimiento de los mercados de Forex y criptomonedas. Mi entusiasmo por los negocios digitales me impulsa constantemente a superar mis propios límites y buscar el éxito. Como firme defensor de la educación financiera, mi objetivo es compartir mi experiencia y sabiduría para ayudarte a alcanzar tus metas. Si estás buscando orientación en trading, forex o criptomonedas, no dudes en ponerte en contacto. Estoy aquí para acompañarte en tu camino hacia el éxito.


Comments (0)