The Beginner's Guide to Technical Analysis: Understanding the Basics
Learn the basics of technical analysis with this comprehensive guide for beginners. Discover how to use charts, indicators, and other tools to identify trends, patterns, and support and resistance levels in financial markets. Understand the challenges and limitations of technical analysis and how to combine it with fundamental analysis and market sentiment to make informed investment decisions.

The Beginner's Guide to Technical Analysis: Understanding the Basics
If you are new to investing, you may have heard about technical analysis and wondered what it is all about. Technical analysis is a method of analyzing financial markets that relies on charts, indicators, and other tools to identify trends, patterns, and support and resistance levels. It is based on the idea that historical price and volume data can help predict future price movements.
While technical analysis has its limitations and challenges, it can be a valuable tool for traders and investors who want to make informed decisions based on market data. In this guide, we will walk you through the basics of technical analysis and introduce you to some of the most commonly used tools and concepts.
Understanding Charts
At the heart of technical analysis is the use of charts. Charts are graphical representations of price and volume data over time. They can show the price movements of individual stocks, indices, currencies, commodities, and other assets. Charts come in different types and timeframes, such as line charts, bar charts, candlestick charts, and more.
Line charts are the simplest type of charts and show only the closing prices of an asset over time. Bar charts show the open, high, low, and close prices of an asset over a given period. Candlestick charts are similar to bar charts but use candlesticks instead of bars to represent price movements. Each candlestick shows the open, high, low, and close prices of an asset for a given period.
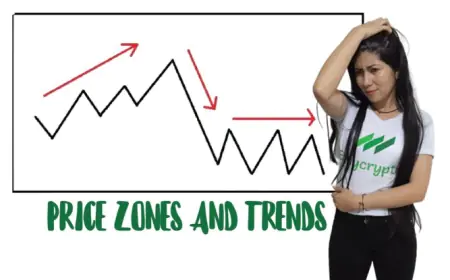
By looking at charts, you can identify trends and patterns that can help you predict future price movements. For example, an uptrend is a series of higher highs and higher lows, while a downtrend is a series of lower highs and lower lows. A trendline can help you draw a straight line that connects the highs or lows of a trend. A support level is a price level where demand for an asset is strong enough to prevent its price from falling further, while a resistance level is a price level where supply for an asset is strong enough to prevent its price from rising further.
Using Indicators
In addition to charts, technical analysts use indicators to confirm or contradict their interpretations of price movements. Indicators are mathematical calculations based on price and/or volume data. They can be displayed on charts or in separate windows.
Some of the most commonly used indicators include moving averages, relative strength index (RSI), stochastic oscillator, and MACD. Moving averages are lines that show the average price of an asset over a given period. They can help you identify trends and support/resistance levels. RSI is a momentum indicator that shows whether an asset is overbought or oversold. Stochastic oscillator is another momentum indicator that compares the current price of an asset to its price range over a given period. MACD is a trend-following indicator that shows the relationship between two moving averages.
Indicators should be used in conjunction with charts and other tools to confirm or reject your analysis of price movements. They should not be used in isolation or as a substitute for sound judgment.
In the next part of this guide, we will discuss the importance of volume, trendlines, and other concepts in technical analysis. Stay tuned!
The Importance of Volume and Trendlines
Volume is another important component of technical analysis. Volume refers to the number of shares, contracts, or units of an asset that are traded during a given period. High volume usually indicates strong buying or selling pressure, while low volume can indicate indecision or lack of interest.
By looking at the relationship between price and volume, you can identify trends and potential reversals. For example, a trend accompanied by high volume is more likely to continue than a trend accompanied by low volume. Similarly, a price movement that is not accompanied by volume is less likely to be sustained.
Trendlines are another key concept in technical analysis. Trendlines are straight lines that connect two or more price points and can help you identify trends and support/resistance levels. An uptrend line connects the lows of an uptrend, while a downtrend line connects the highs of a downtrend. A trendline can also act as a support or resistance level.
It is important to note that trendlines are not always precise and can be subject to interpretation. Therefore, it is advisable to use other tools and indicators to confirm or reject your analysis.
Combining Technical Analysis with Fundamental Analysis and Market Sentiment
While technical analysis can be a powerful tool for traders and investors, it is not infallible and should be used in conjunction with other forms of analysis, such as fundamental analysis and market sentiment.
Fundamental analysis focuses on the underlying factors that can affect an asset's price, such as economic indicators, financial statements, and industry trends. By analyzing these factors, you can gain a better understanding of an asset's intrinsic value and potential for growth.
Market sentiment refers to the overall attitude or mood of traders and investors towards a particular asset or market. It can be influenced by a wide range of factors, such as news events, economic data, and geopolitical developments. By understanding market sentiment, you can gauge the level of risk and uncertainty associated with an asset or market.
By combining technical analysis with fundamental analysis and market sentiment, you can make more informed investment decisions. For example, you can use technical analysis to identify potential entry and exit points, and fundamental analysis to evaluate an asset's long-term potential. Market sentiment can help you determine the level of risk associated with a particular investment.
Common Technical Indicators
There are many technical indicators that traders use to analyze price movements and identify trends. Here are a few of the most common:
-
Moving Averages: A moving average is a line that shows the average price of an asset over a given period of time. Moving averages can help you identify trends and potential support and resistance levels.
-
Relative Strength Index (RSI): The RSI is a momentum indicator that measures the strength of a trend and potential reversals. The RSI ranges from 0 to 100, with readings above 70 indicating overbought conditions and readings below 30 indicating oversold conditions.
-
Bollinger Bands: Bollinger Bands are a volatility indicator that consists of three lines: a moving average and two standard deviation bands. The upper and lower bands can help you identify potential buy and sell signals.
-
Fibonacci Retracement: The Fibonacci retracement is a technical analysis tool that uses horizontal lines to indicate areas of support or resistance at the key Fibonacci levels before the price continues in the original direction.
-
Moving Average Convergence Divergence (MACD): The MACD is a trend-following momentum indicator that shows the relationship between two moving averages of an asset's price.
There are many other technical indicators available, and it's important to choose the ones that work best for your trading strategy and style.
Putting Technical Analysis into Practice
To put technical analysis into practice, you can start by selecting an asset that you want to trade or invest in and analyzing its price movements using the tools and concepts outlined in this article. Here are a few steps to get started:
-
Determine the time frame you want to analyze, such as daily, weekly, or monthly.
-
Identify trends and potential support and resistance levels using trendlines, moving averages, and other technical indicators.
-
Analyze volume and market sentiment to confirm or reject your analysis.
-
Use your analysis to identify potential entry and exit points, and set stop-loss orders to manage risk.
-
Monitor your trades and adjust your strategy as needed based on new information and market conditions.
By using technical analysis in conjunction with other forms of analysis and risk management strategies, you can make more informed investment decisions and increase your chances of success in the markets.
Conclusion
Technical analysis is a powerful tool for traders and investors who want to make informed decisions based on market data. By understanding the basics of technical analysis, you can identify trends, patterns, and support and resistance levels that can help you predict future price movements. However, it is important to remember that technical analysis is not infallible and should be used in conjunction with other forms of analysis, such as fundamental analysis and market sentiment. By combining these approaches and using risk management strategies, you can increase your chances of success in the markets.
What's Your Reaction?
 Like
0
Like
0
 Dislike
0
Dislike
0
 Love
0
Love
0
 Funny
0
Funny
0
 Wow
0
Wow
0
 Sad
0
Sad
0
 Angry
0
Angry
0
Soy un trader e inversionista apasionado con un profundo conocimiento de los mercados de Forex y criptomonedas. Mi entusiasmo por los negocios digitales me impulsa constantemente a superar mis propios límites y buscar el éxito. Como firme defensor de la educación financiera, mi objetivo es compartir mi experiencia y sabiduría para ayudarte a alcanzar tus metas. Si estás buscando orientación en trading, forex o criptomonedas, no dudes en ponerte en contacto. Estoy aquí para acompañarte en tu camino hacia el éxito.


Comments (0)